Highlights: Strong month for Google search — the Homeowner Insurance campaign drove 125 conversions at $14.70 CPA with 120 phone calls. Meta generated 63 website purchases focused on homeowners in targeted zip codes. Combined, the account produced 252 total conversions across both platforms.
| Campaign | Status | Spend | Clicks | Conv. | CPA | Calls |
|---|---|---|---|---|---|---|
| SRCH || Homeowner Insurance | Active | $1,838 | 652 | 125 | $14.70 | 120 |
| PMAX | General | Active | $927 | 678 | 49 | $18.92 | 18 |
| Search | General | Phone Calls | Paused | $194 | 28 | 12 | $16.18 | 20 |
| PMAX | General #2 | Active | $84 | 32 | 3 | $28.06 | 10 |
| Total | $3,043 | 1,390 | 189 | $16.10 | 168 |
| Campaign | Status | Objective |
|---|---|---|
| Sales Campaign | Homeowners | CFP | [Zip Codes] | Active | Sales — Website Purchases |
| Sales Campaign | Homeowners | CFP | V2 | Active | Sales — Website Purchases |
Strategy: Focused on two active Sales campaigns targeting homeowners in specific zip codes affected by California fire risk. Paused underperforming campaigns (Auto Insurance, Traffic, Retarget) to concentrate budget on the highest-converting Homeowners campaigns. Lead form updated to "Your Role in the Agency/Company" for better qualification.
Top Performing Creatives — Ranked by Cost Per Purchase
Creative performance ranked by efficiency. Lower cost per purchase = better performance.
| Rank | Creative | Spend | Purchases | Cost/Purchase | CTR |
|---|---|---|---|---|---|
| 🥇 | Still Image #2 | $646.08 | 22 | $29.37 | 1.43% |
| 🥈 | Still Image #7 (V1) | $1,027.50 | 15 | $68.50 | 1.81% |
| 🥉 | Still Image #7 (V2) | $780.88 | 14 | $55.78 | 1.69% |
| 4 | Still Image #2 (V2) | $486.55 | 13 | $37.43 | 1.52% |
| 5 | Image #4 | $217.63 | 9 | $24.18 | 1.35% |
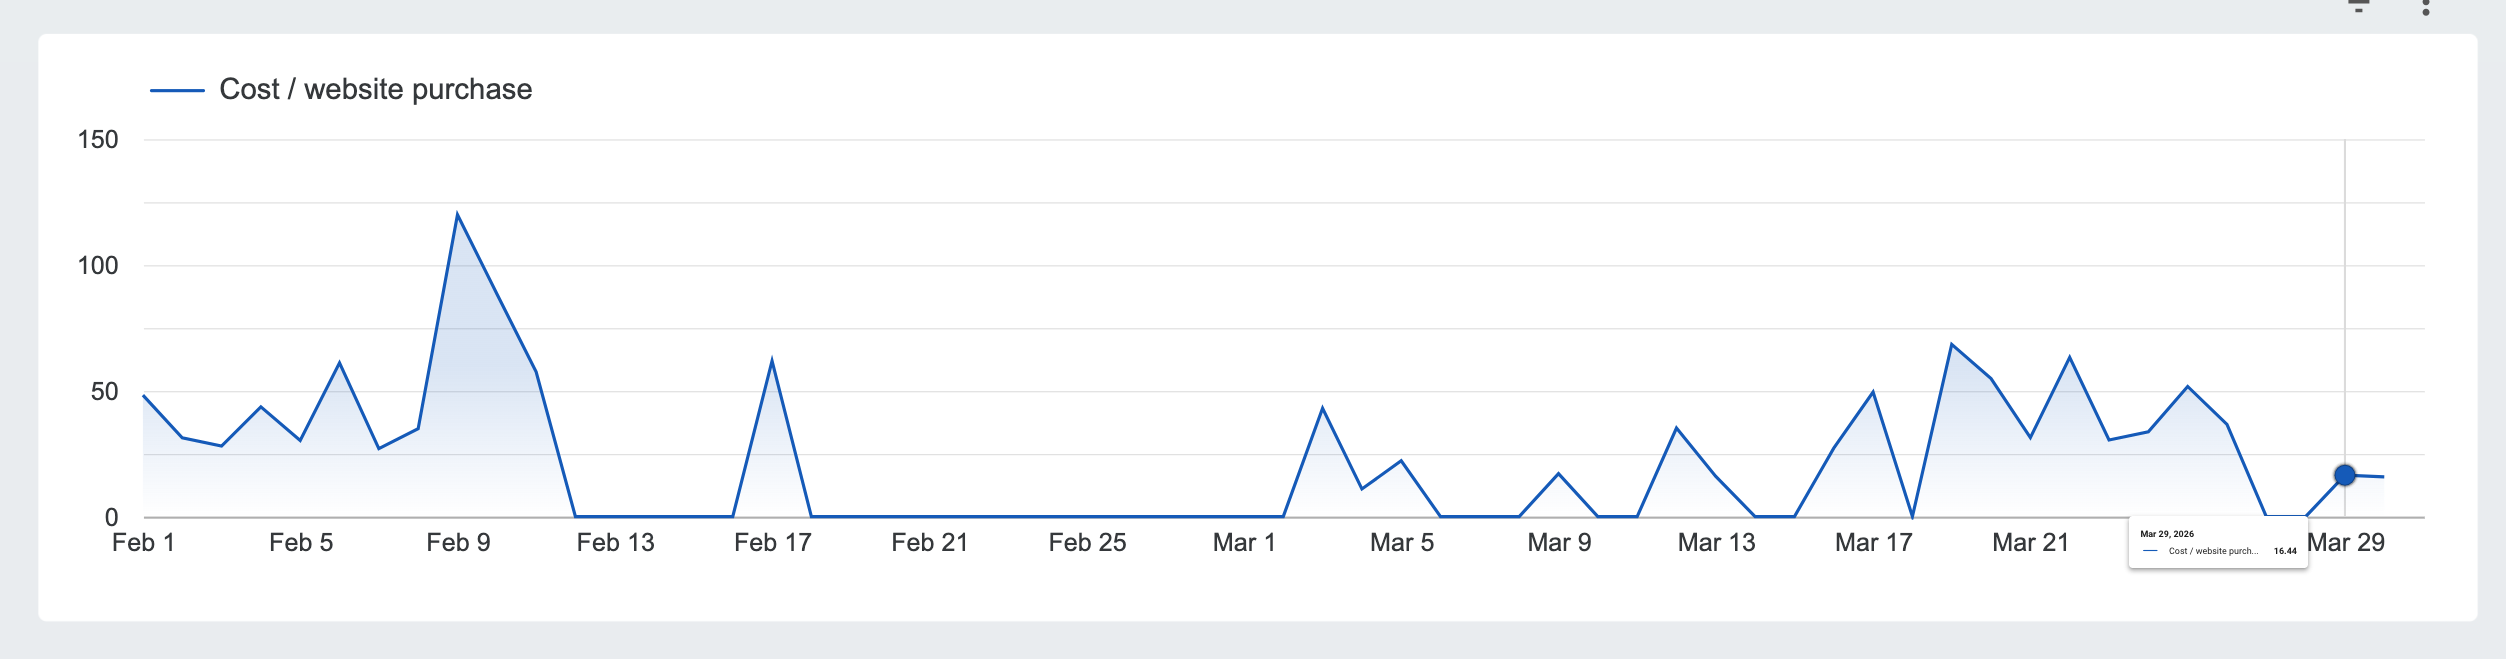
Cost Per Website Purchase — Trending Down
Meta cost per purchase has been consistently decreasing since early February, from peaks of $120+ down to under $20 in late March — campaign optimization and audience refinement paying off.
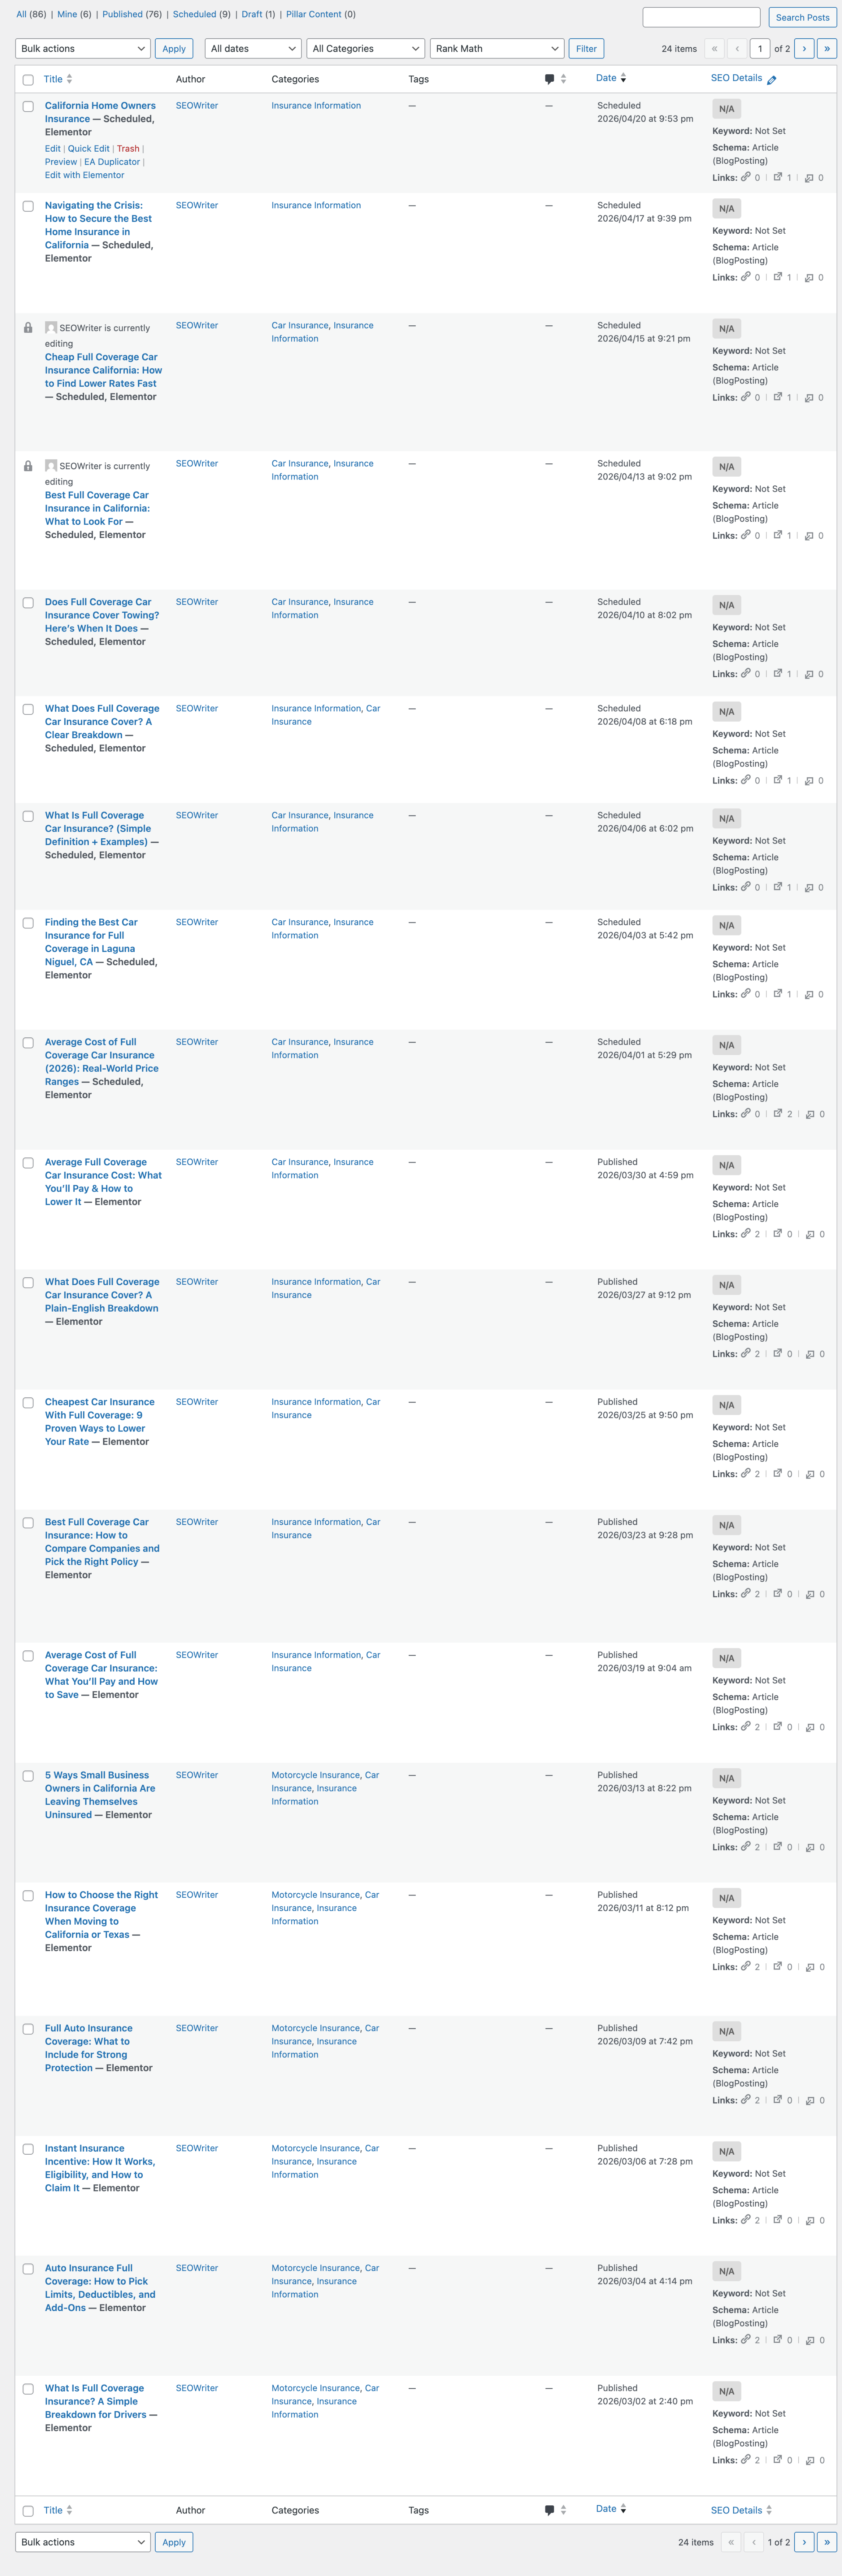
Blog Posts Published in March
- What Is Full Coverage Insurance: A Simple Breakdown for Drivers
- Auto Insurance Full Coverage: How to Pick Limits, Deductibles & Add-Ons
- Instant Insurance Incentive: How It Works, Eligibility & How to Claim It
- Full Auto Insurance Coverage: What to Include for Strong Protection
- How to Choose the Right Insurance Coverage When Moving to CA or TX
- 5 Ways Small Business Owners in CA Are Leaving Themselves Uninsured
- Average Cost Full Coverage Car Insurance: What You'll Pay & How to Save
- Best Full Coverage Car Insurance: How to Compare & Pick the Right Policy
- Cheapest Car Insurance with Full Coverage: 9 Proven Ways to Lower Your Rate
- What Does Full Coverage Car Insurance Cover: A Plain English Breakdown
- Average Full Coverage Car Insurance Cost: What You'll Pay & How to Lower It
SEO Strategy: Published 11 high-intent blog posts targeting full coverage car insurance keywords. Each post targets specific long-tail keywords that homeowners and drivers actively search for, building organic authority and driving free traffic to globalguardins.com. Currently ranking for 1,065 organic keywords with $18,780/month in equivalent ad value.
- Created new campaigns with top zip codes that have applied for fire insurance
- Turned on Meta campaigns and started ramping up budget
- Changed Meta content to reflect that GGIS compares all available options to guarantee the best rate and coverage for home insurance
- Updated ad content on Meta
- Adjusted Meta lead form from "What best describes your role" to "Your Role in the Agency/Company"
- Refreshed creatives
- Included additional design and adjusted budget for optimization
- Fixed headlines and added Valentine's content to Meta
- Completed website updates
- Swept all pages to ensure no mentions of CFP on links
- Verified landing pages do not have California Fair Plan references
- Investigated and resolved Jotform leads issue — client was not receiving leads since March 5th
- Ensured Jotform is being used and functioning properly
- Shared GTM access with Janz and Sam
- Created full SEMrush report
Coming Up Next
- • Continue optimizing Homeowner Insurance search campaign for lower CPA
- • Monitor PMax General #2 performance — evaluate scaling or pausing
- • Test new Meta creative angles for fire insurance zip code targeting
- • Ongoing SEO monitoring and keyword growth tracking
- • Review lead quality from Jotform submissions